
How to Look Up Bucks County Jail Population Data
Bucks County jail population data lives in a few places, and no single source has it all. The county's own Corrections page describes the facility structure and staffing, but it does not post a current daily head count or a rated capacity. That is an important gap to know up front. For trend numbers, the strongest free source is the Vera Institute Incarceration Trends page for Bucks County. For national and state context, the Bureau of Justice Statistics Jail Inmates tables fill in the wider picture.
Each source updates on its own clock. The Vera page draws on national jail data collections, so its figures move year to year rather than day to day. The Vera page for Bucks County was updated February 9, 2026. The county Corrections page changes when the county revises it, not on a fixed schedule. BJS publishes its jail tables in annual cycles tied to its data year. So none of these give you a live, same-day count. They give structure, trend, and context.
Reading the Vera dashboard helps. It charts the number of people in jail, and where the data exist, it splits out sentenced, pretrial, total, and capacity. It also shows the incarceration rate per 100,000 residents ages 15 to 64, race and ethnicity disparity, and holds for other authorities. Treat the charted numbers as the official tallies Vera collected, and treat any gaps as data the county did not report. When a figure is missing, that absence is the answer, not a reason to guess.
Bucks County Jail Capacity Overview
The Bucks County correctional campus is built around three facilities, each with its own role. The county Corrections page confirms this structure and notes the department employs more than 340 staff. What the county does not publish is a rated capacity for the campus or for any single building. So while the facility list is clear, the bed counts are not on the record.
The three facilities split the work by custody type and gender. Intake and classification run through one building. Lower-custody men and work release sit in another. All female commitments go to a third.
| Facility | Role | Rated Capacity |
|---|---|---|
| Main Correctional Facility | Intake, processing, classification, and general custody | Not published |
| Men's Community Corrections Center | Medium and minimum male offenders; work release | Not published |
| Women's Correctional Facility | All female county commitments; work-release-eligible women | Not published |
Because the county lists no bed totals, any capacity figure you see elsewhere should be checked against an official record before you rely on it. The Vera page may chart a capacity line for some years if that data was reported, but the county itself does not post one. Note: a missing capacity number is not the same as zero, so read each chart for what it actually shows.
Average Daily Population
Average daily population, or ADP, is the mean number of people held across a set period. It smooths out the daily ups and downs and gives a truer sense of how full a jail runs. Many counties report an ADP. Bucks County does not publish one that could be located, and it does not post a current daily count either.
That leaves trend data as the next best read. The Vera Institute page tracks the number of people in the Bucks County jail across years, drawn from national jail data collections. Those yearly figures act as a stand-in for the local ADP picture, even though they are not labeled an official county average. Where Vera shows a total jail population for a given year, that is the closest public proxy to ADP for Bucks County.
What pushes the daily number around is steady. Arrests add people. Bail and pretrial release decisions move people out before trial. Probation and parole violations bring people back in. Sentencing, court backlog, and state or federal holds all bend the count. The county also runs Recovery Court, Wellness Court, and Veterans Treatment Court, which route some high-need defendants into structured supervision or treatment instead of a jail bed. Those programs ease pressure on the population.
Demographic Breakdown
A demographic breakdown splits the jail population by gender, race and ethnicity, and age. It shows who is held, not just how many. Bucks County does not publish a current demographic breakdown of its jail population that could be located, so there is no official local table of percentages to report here.
The Vera Institute page helps fill part of that gap with context. For Bucks County it charts race and ethnicity disparity in the jail, comparing incarceration across groups rather than giving a simple head-count split. That kind of disparity measure is useful, but it is not the same as a full county roster broken out by category. For broad sex and race and ethnicity patterns, the BJS tables describe how jail populations look at the state and national level.
Because the county posts no figures, no demographic percentages are listed below. The honest read is that the local breakdown is not on the public record. Anyone who needs verified county demographics would have to ask the county directly. Use Vera for disparity trends and BJS for the wider pattern, and keep the two clearly separate from any county claim.
Pretrial vs. Sentenced Population
Jail populations split into two big groups. Pretrial means a person is held before any conviction, often because they have not posted bail. Sentenced means a person is serving a county sentence after a guilty plea or verdict. The mix matters, since a heavy pretrial share points to bail and court-speed issues rather than punishment.
Bucks County does not publish its own pretrial-versus-sentenced split that could be located. The Vera Institute page may separate sentenced and pretrial counts for some years where the underlying data exist, so the chart is the place to check. When both lines appear, you can see how the county balance has shifted over time.
For a sense of the national norm, the BJS Jail Inmates tables report pretrial and sentenced shares across the country. Local jails nationwide tend to hold a large pretrial share, since people awaiting trial cycle through county jails while convicted felons with longer terms move to state prison. That pattern gives a backdrop for reading any Bucks County figure, but it does not substitute for a county number. Where the county is silent, the split is simply not published.
Misdemeanor vs. Felony Population
County jails hold a wide mix of charge levels. The same building can hold a pretrial defendant facing a felony and a person serving a short county term for a misdemeanor. Both belong in the county system. What does not stay local is the long felony sentence.
In Pennsylvania, people serving longer state felony terms are held by the Pennsylvania Department of Corrections, not the county jail. So the Bucks County facilities skew toward pretrial detainees and shorter county sentences across both misdemeanor and felony cases. A felony charge alone does not mean state prison; it depends on the sentence and where it falls.
Bucks County does not publish a misdemeanor-versus-felony breakdown of its jail population that could be located. There is no official local count to list. The general structure holds, though: the county jail is a mix of pretrial and short-term sentenced people, while the heaviest felony terms are served elsewhere in the state system.
Mental Health and Medical Population
Every jail carries a share of people who need mental health care or medical treatment. Some arrive with chronic conditions. Some need detox or steady medication. County jails have to manage all of it, and that population shapes staffing and cost even when it is not counted in public.
Bucks County addresses part of this need through its specialty courts. The Wellness Court serves defendants with serious mental illness, offering structured supervision and treatment as an alternative path. Recovery Court and Veterans Treatment Court reach other high-need groups. These programs can pull people out of a jail bed and into care, which eases the load on the facilities.
Specific counts of the mental health or medical population are not published by the county and could not be located. So while the need is real and the programs are documented, the exact number of people receiving care inside the jail is not on the public record.
National and State Context
To judge whether a county jail runs high or low, you need a yardstick. That is where national and state data come in. The Bureau of Justice Statistics tracks jail populations across the whole country and reports them in regular statistical tables. Those tables cover pretrial and sentenced shares, sex, race and ethnicity, and the jail incarceration rate per 100,000 residents.
The full national tables are published by BJS and can be read in detail online.
You can review the BJS Jail Inmates statistical tables for the national and state numbers that frame any single county.
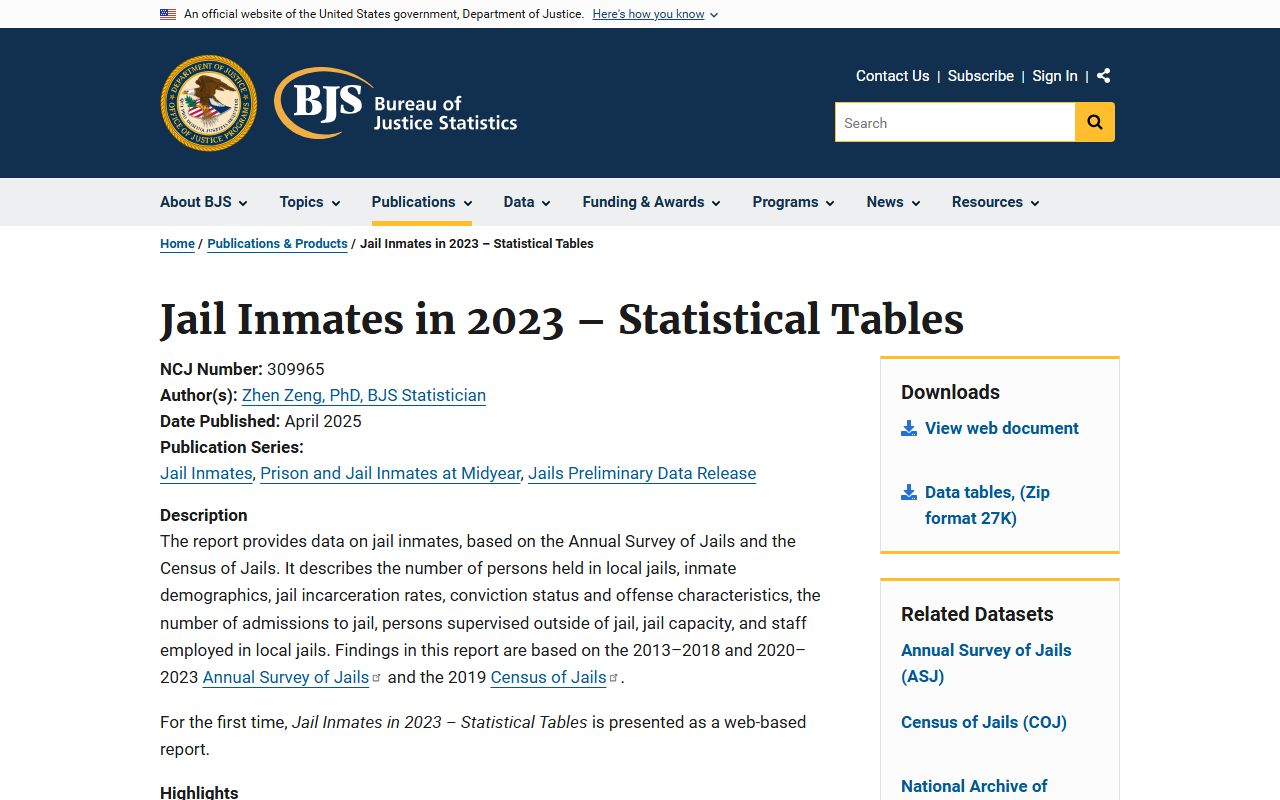
That BJS release is the standard source for placing Bucks County against the rest of the state and country. Because exact county and state rates are not all listed in one place, the table below shows which source gives which figure rather than inventing a number.
| Level | Source for the Rate |
|---|---|
| Bucks County | Vera Institute, rate per 100,000 residents ages 15 to 64 |
| Pennsylvania | Vera Institute, state rate per 100,000 residents ages 15 to 64 |
| National | BJS Jail Inmates tables, national jail rate per 100,000 |
Note: Vera and BJS use different age bases for their rates, so the county, state, and national figures are not always a clean apples-to-apples match.
Population Trends Over Time
Trends tell a story that a single day cannot. A jail count that has fallen for years points to policy shifts, diversion programs, or fewer admissions. A rising count points to more arrests, slower courts, or tighter bail. The Vera Institute page is built to show this arc for Bucks County across many years.
The Vera trends page charts the rise and fall of the Bucks County jail population over time.
You can explore the Vera Institute Incarceration Trends page for Bucks County to see the multi-year jail trend line.
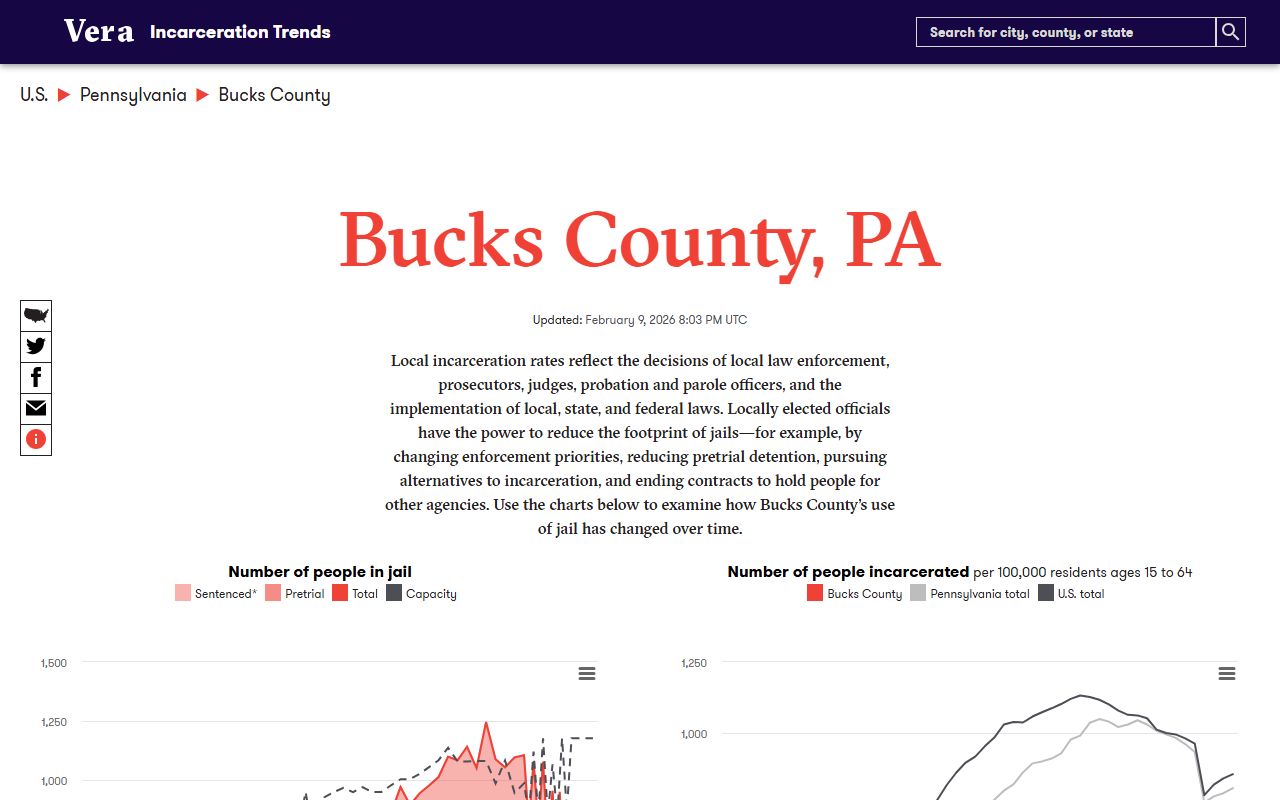
Vera last updated its Bucks County page on February 9, 2026, so the trend reflects data collected through recent cycles. The chart pulls together the number of people in jail, the incarceration rate per 100,000 residents ages 15 to 64, race and ethnicity disparity, and holds for other authorities. Where the county reported sentenced, pretrial, total, and capacity, Vera plots those too. Read the trend as a shape, not as a live count, and remember the county itself does not post a daily figure to check it against.
Searching for Bucks County Inmate Records by Name
Population data does not name anyone. It counts heads, it does not identify them. To look up a specific person in custody, use the Bucks County inmate records page, which covers the county inmate lookup and the phone system for confirming a booking by name. That page is the right tool for an individual search, while the numbers above are for the jail population as a whole.
Where the Data Comes From
Knowing the source behind each number keeps the picture honest. Three sources carry the load for Bucks County jail population data, and each does a different job. The county provides the facility structure. Vera provides the trend and the rate. BJS provides the national and state frame. None of the three publishes a live daily count for Bucks County.
| Source | What It Provides |
|---|---|
| Bucks County Corrections | Facility structure, the three-facility campus, and staffing of more than 340 employees; no daily count or rated capacity. |
| Vera Institute Incarceration Trends | Number of people in jail, sentenced/pretrial/total/capacity where reported, rate per 100,000 ages 15 to 64, disparity, and holds; updated February 9, 2026. |
| BJS Jail Inmates tables | National and state context for pretrial and sentenced shares, sex, race and ethnicity, and jail rates. |
The bottom line is plain. For verified county figures beyond the facility setup, the county would have to be asked directly. For trends and rates, lean on Vera. For the national backdrop, lean on BJS. And treat any county-specific count that is not published as exactly that, not published, rather than guessing a value.